This template uses the datatype pair Dividend Payout Ratio and Total Current Liabilities. It emphasizes downside control and portfolio stability over aggressive upside pursuit. Historically this profile is associated with lower realized volatility, lower active-risk behavior, and shallower drawdown patterns relative to high-octane styles. In practical terms, it often behaves as a risk-tempering allocation profile that aims for smoother benchmark-relative participation across regimes.
Screener-N3 continually learns which combinations improve selection quality over time.
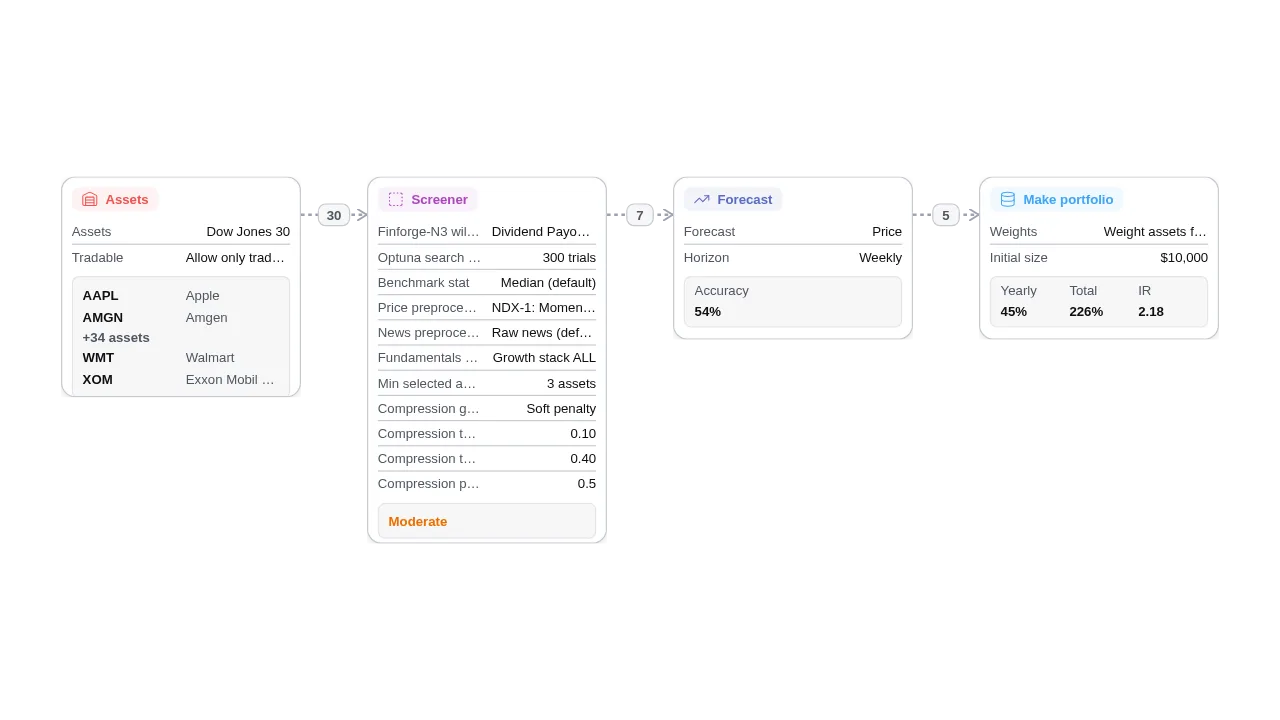
The screened assets are then passed into Forecast-N3, which estimates near-term return direction and magnitude.
Rather than applying another hard screen, the flow goes straight into portfolio construction, where stronger forecasts receive larger weights.
The result is a structure that keeps diversification from the screener while allowing the model to react more quickly through dynamic sizing.
That makes node chaining meaningful: screening reduces noise, forecasting adds timing, and portfolio construction turns both into actionable allocations.